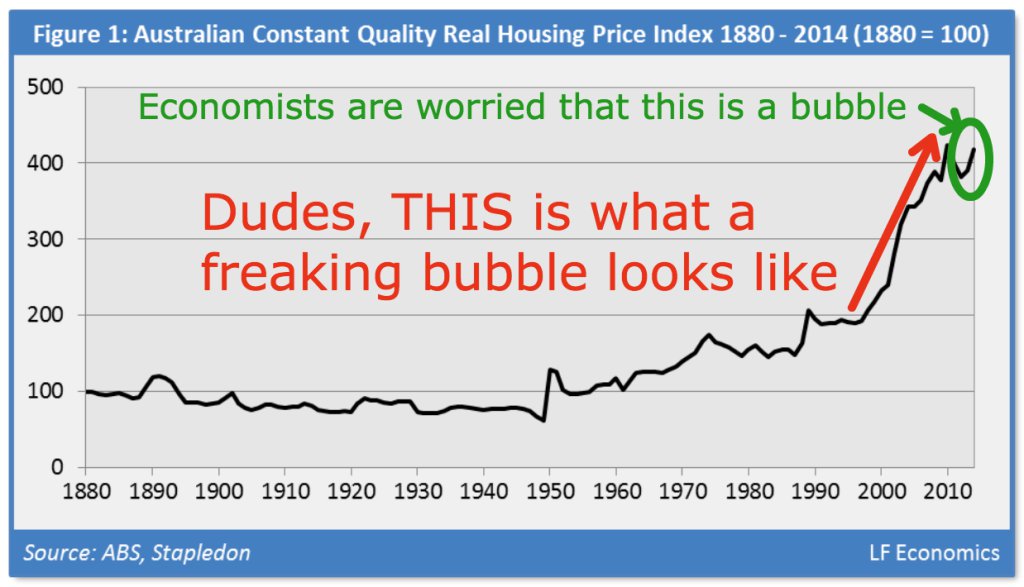
Taken from The housing crash we had to have: A Gen Y perspective on the bubble.
Korean girls’ attitude to plastic surgery in 3 frames
Australia – a very high taxing country
Repost of an excellent article from the AFR.
No matter how you dice the numbers, Australians pay high taxes – but they are not better governed as a result
Whichever way you look at it, our taxes are high.They are high by historic standards. Fifty years ago, taxes were about $5000 per person after adjusting for inflation. This grew to around $8000 per person by the mid‑1970s, $11,000 by the mid‑1980s, $12,000 by the mid‑1990s and $17,000 by the mid‑2000s. Today the tax burden is around $19,000 per person, still allowing for inflation.
Even if the tax burden had grown in line with growth in wages and the economy, it would only be $13,000 per person. Those bleating about crashing revenues are on another planet. Their complaint, in essence, is that taxes ought to grow even faster.
There is no justification for the ever-expanding tax burden. Living standards for all groups of society have risen over the last 50 years, which means the need for government welfare services has declined. And we haven’t uncovered new forms of effective government intervention either. To the contrary, the prosperity‑promoting effects of free markets and the many failings of government involvement have been demonstrated time and again.
Yet the growth of tax is unwavering, supported by the fact that its collection over the decades has become both hidden and automatic, a development euphemistically known as “tax efficiency”.
Our taxes are also high by international standards. The Coalition, Labor and the Greens will tell you that Australia’s tax burden is about 28 per cent of GDP, compared with an OECD average of about 34 per cent. This is a con job using dodgy statistics.
The 34 per cent figure is a simple average that puts the same weight on each of the 34 countries of the OECD. Thus high‑taxing Iceland has as much impact on the average as the lower‑taxing United States, even though the US’s population is 1000 times bigger than Iceland’s.
If you properly account for the different sizes of the OECD countries, the average tax burden in the OECD comes out at 30 per cent of GDP.
What’s more, this weighted average for the OECD is bumped up by the inclusion of “social security” or “national insurance” contributions present in most countries of the OECD except Australia –while the tax burden figure for Australia is artificially kept down by the exclusion of superannuation guarantee payments.
If superannuation guarantee payments are excluded, then at least some of the social security contributions in other countries should be excluded too. After all, both are compulsory, they add to the individual payer’s retirement income, and their preservation for retirement is similarly subject to significant government manipulation and pilfering.
Once we exclude both from the calculations, the weighted average tax burden in the OECD falls to 22 per cent of GDP, while Australia’s tax burden remains at 28 per cent of GDP. And even if we exclude only half of the social security contributions on the grounds that only half of them resemble Australia’s superannuation guarantee payments, the OECD average tax burden would still be lower than Australia’s tax burden.
HIGH-TAX COUNTRY
Another way to compare tax burdens in a fair way is to include both superannuation guarantee payments and social security contributions in the calculations. Under this approach, the weighted average tax burden in the OECD is 30 per cent of GDP, while Australia’s tax burden rises to 31 per cent of GDP.
So no matter which way you look at it, Australia is a high tax country, even by OECD standards.
But we shouldn’t be comparing ourselves to the debt-ridden, stagnant basket cases of the old world. If we want to be more prosperous, we should compare ourselves with the richest and most dynamic countries in the world.
There are four non-OECD countries that are richer than us — Singapore, Hong Kong, Qatar and the United Arab Emirates. We compete with each of these for investment, skilled workers and entrepreneurs, and each country has a markedly lower tax burden than Australia. The tax burden in Singapore and Hong Kong is about14 per cent of GDP, and even lower in Qatar and the UAE.
The Coalition, Labor and the Greens will tell you again and again that our taxes are low. Every time this lie is repeated, it needs to be refuted. And in this task, I’m happy to be a broken record.
Every Fat Acceptance Debate Ever
I think we should let these propagandists put their money where their mouth is and allow health insurers charge premiums based on the obesity characteristics of people. This way the free market will decide based on empirical data whether their condition results in more health issues or not.
Negative Gearing is a tax shelter for fat cats
The lack of logic in Sydney’s property prices
Sydney is the most expensive city in the world when it comes to land, apart from HK and Vancouver. It is often compared with other major cities which have very expensive land – but how does it actually stack up in terms of density?
As you can see, there is literally zero justification for the sorts of land prices we are seeing in Sydney. There is far from any shortage of land to develop. There are NO fundamentals at play here, there is NOTHING different, just a great big bubble.
I will re-iterate that by my own calculations, which state that if Sydney had HK’s density, it’s entire population could fit into an area less than one half the size of the Eastern Suburbs.
ABC Q&A Fail
Disgraceful
Negative Gearing becoming a popular topic
Pretty much all over the news in the last few weeks, yay. Toby Idiot Abbott of course ruled out any changes – so here’s to hoping he gets disposed sooner than later.
Dirty Cash – Trans Pacific Partnership
The Fall of the Iron Reich
This is great. NB: At the current trend, iron is set to be worth $0 a tonne by January of 2016.
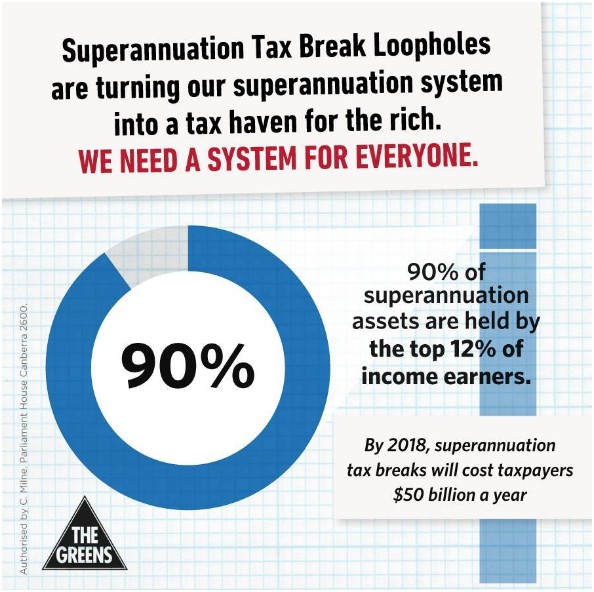
End Super Rorts? No shit Sherlock
No economic rationale for Australian housing
“One of the central bankers present asked: ‘What’s going on in Australia?’ to which the research economist replied: ‘We’ve given up thinking about Australia. There is no economic rationale for it’,” he said in a Deloitte roundtable on the Australian mortgage industry.
As one MB poster puts it…
The worlds most overvalued banks
The worlds most overvalued houses
The worlds most overvalued currency
The worlds most over rated (AAA) government
(one of) The worlds largest private debt issue (s)
The worlds largest financial system exposure to mortgages
The worlds largest per capita migration intake
The worlds most profoundly uncompetitive exposed sector
The worlds most concentrated media
The worlds most spectacularly financially non viable and indebted media
The words most deliberately specious politicians when it comes to doing anything about the aboveThe worlds most utterly rooted economic narrative
Pass the popcorn, it will be a fun few years!
First Home Buyers can choose from only 5.4% of Sydney’s properties
“For Sydney, the numbers are just amazing,” said Diaswati Mardiasmo, PRD Nationwide’s national research manager. “If you have $1 million you can afford 49 per cent of Sydney but if you cut it down in half to $550,000, you can only afford 5.4-10 per cent. That’s a massive drop in terms of affordability”…
Hockey talks crap on super, gets schooled on negative gearing
Why isn’t Joe Hockey behind bars?
So we have the second most overpriced property in the world, and apparently the solution is to force younger generations to speculate on property using their retirement savings.
Nothing short of outright parasitic behaviour by a generation of self-entitled baby boomers, every economist and economic commentator has denounced the proposal. But now, PWC have some some analysis to conclude this will also blow a massive $31Bn hole in the federal budget by the year 2050.
The loss to government – which taxes earnings on super balances at 15 per cent – would be $1.1 billion in 2016-17, and fluctuate between $611 million and $993 million over the next nine years. By 2049-50, the figure would hit $2.1 billion, taking the accumulated hit to government to $31 billion, according to the estimate.
Such blatant outright corruption, at the highest level of politics in Australia.


